
Smart Charts
Say the chart.
See the chart.
"NVDA data-center revenue vs. gross margin, quarterly, last 3 years" — typed once, charted instantly on live data. And when you want full control, the composable builder underneath lets you construct any series a spreadsheet could, without the spreadsheet.
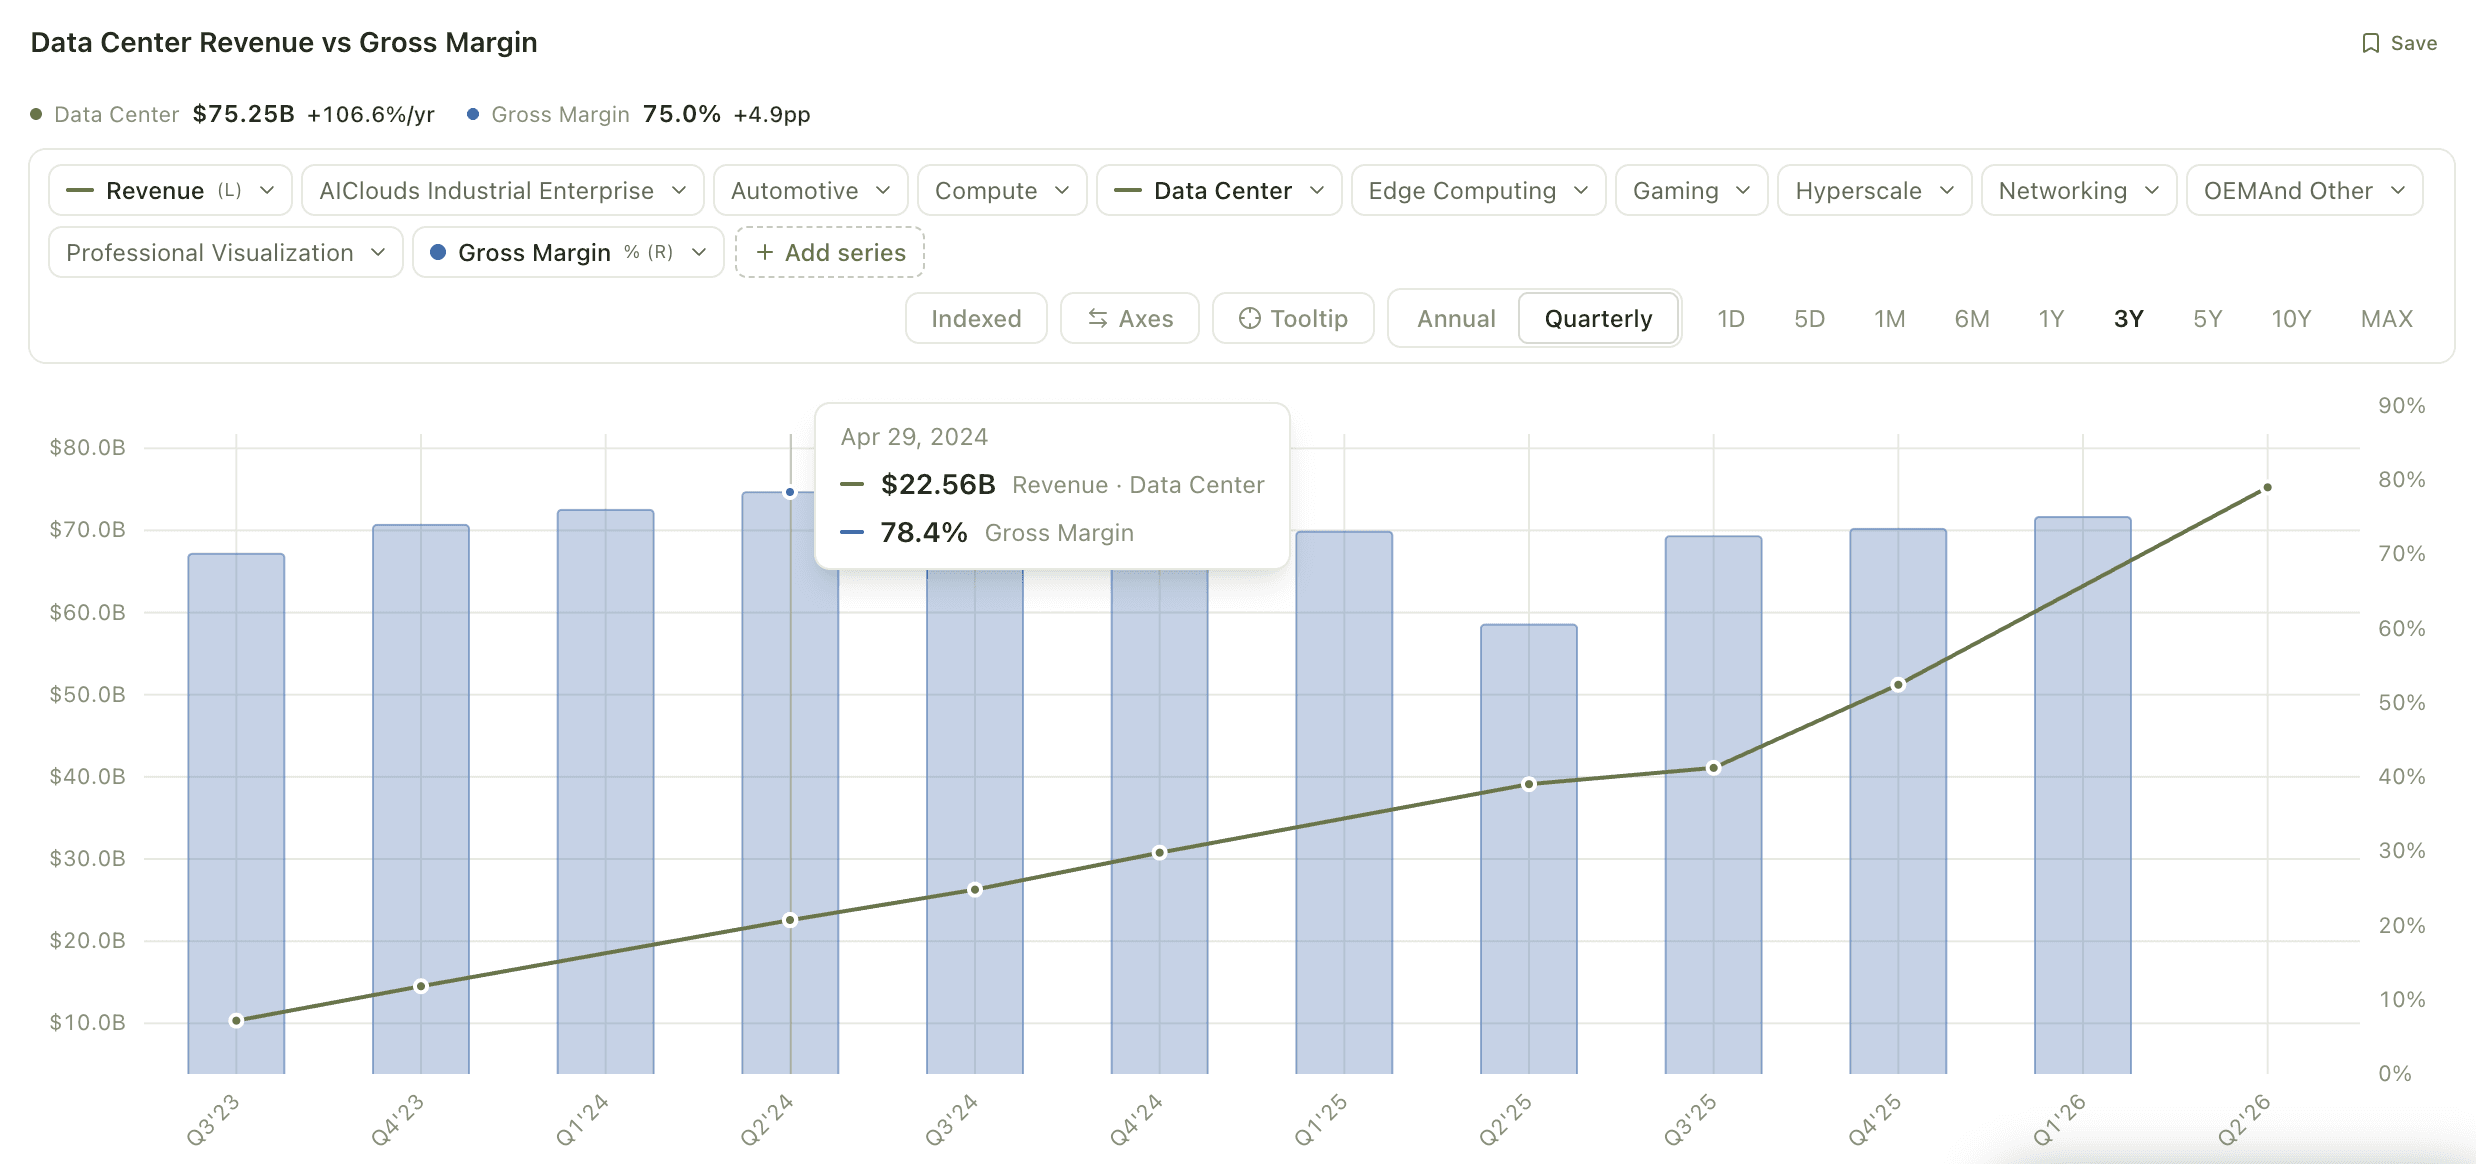
Natural language in
From sentence to chart in one step
Most charting tools make you find the metric, set the period, configure the axis, and repeat for every series. Smart Charts collapses that: describe what you want to see and the AI assembles the spec — metrics, comparisons, timeframe, axes — on live data, ready to refine.
- Price, fundamentals, segments, and indicators in one grammar
- Compare tickers, benchmarks, and metrics in the same view
- Iterate conversationally — "make it quarterly", "add AMD"
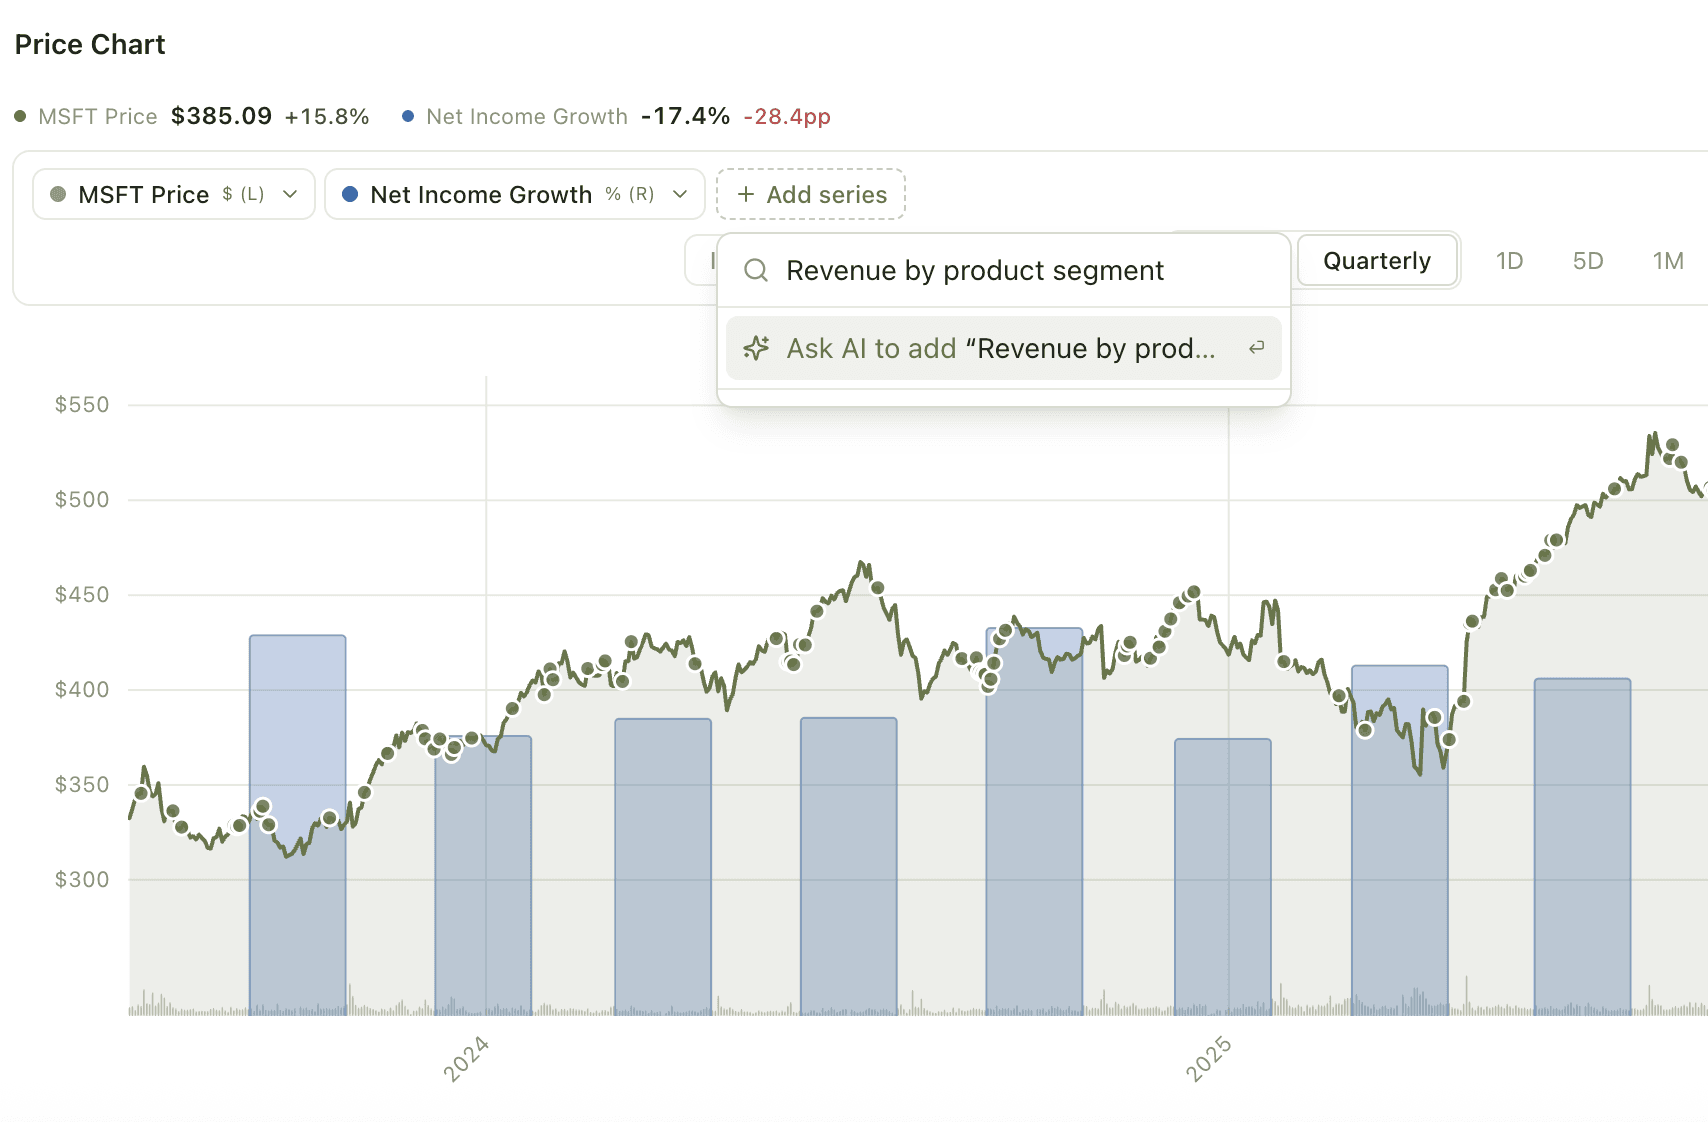
The builder underneath
A chart builder with no ceiling
Every smart chart opens into the same composable builder: add any metric as a series, derive custom ratios between metrics, split series across dual axes, and overlay technical indicators. It is one chart system for price action and fundamentals — because real questions cross that line.
- Any financial metric or price series, on one canvas
- Derived ratios — chart revenue per employee or capex over sales
- Dual axes, comparisons, and indicators without mode switches
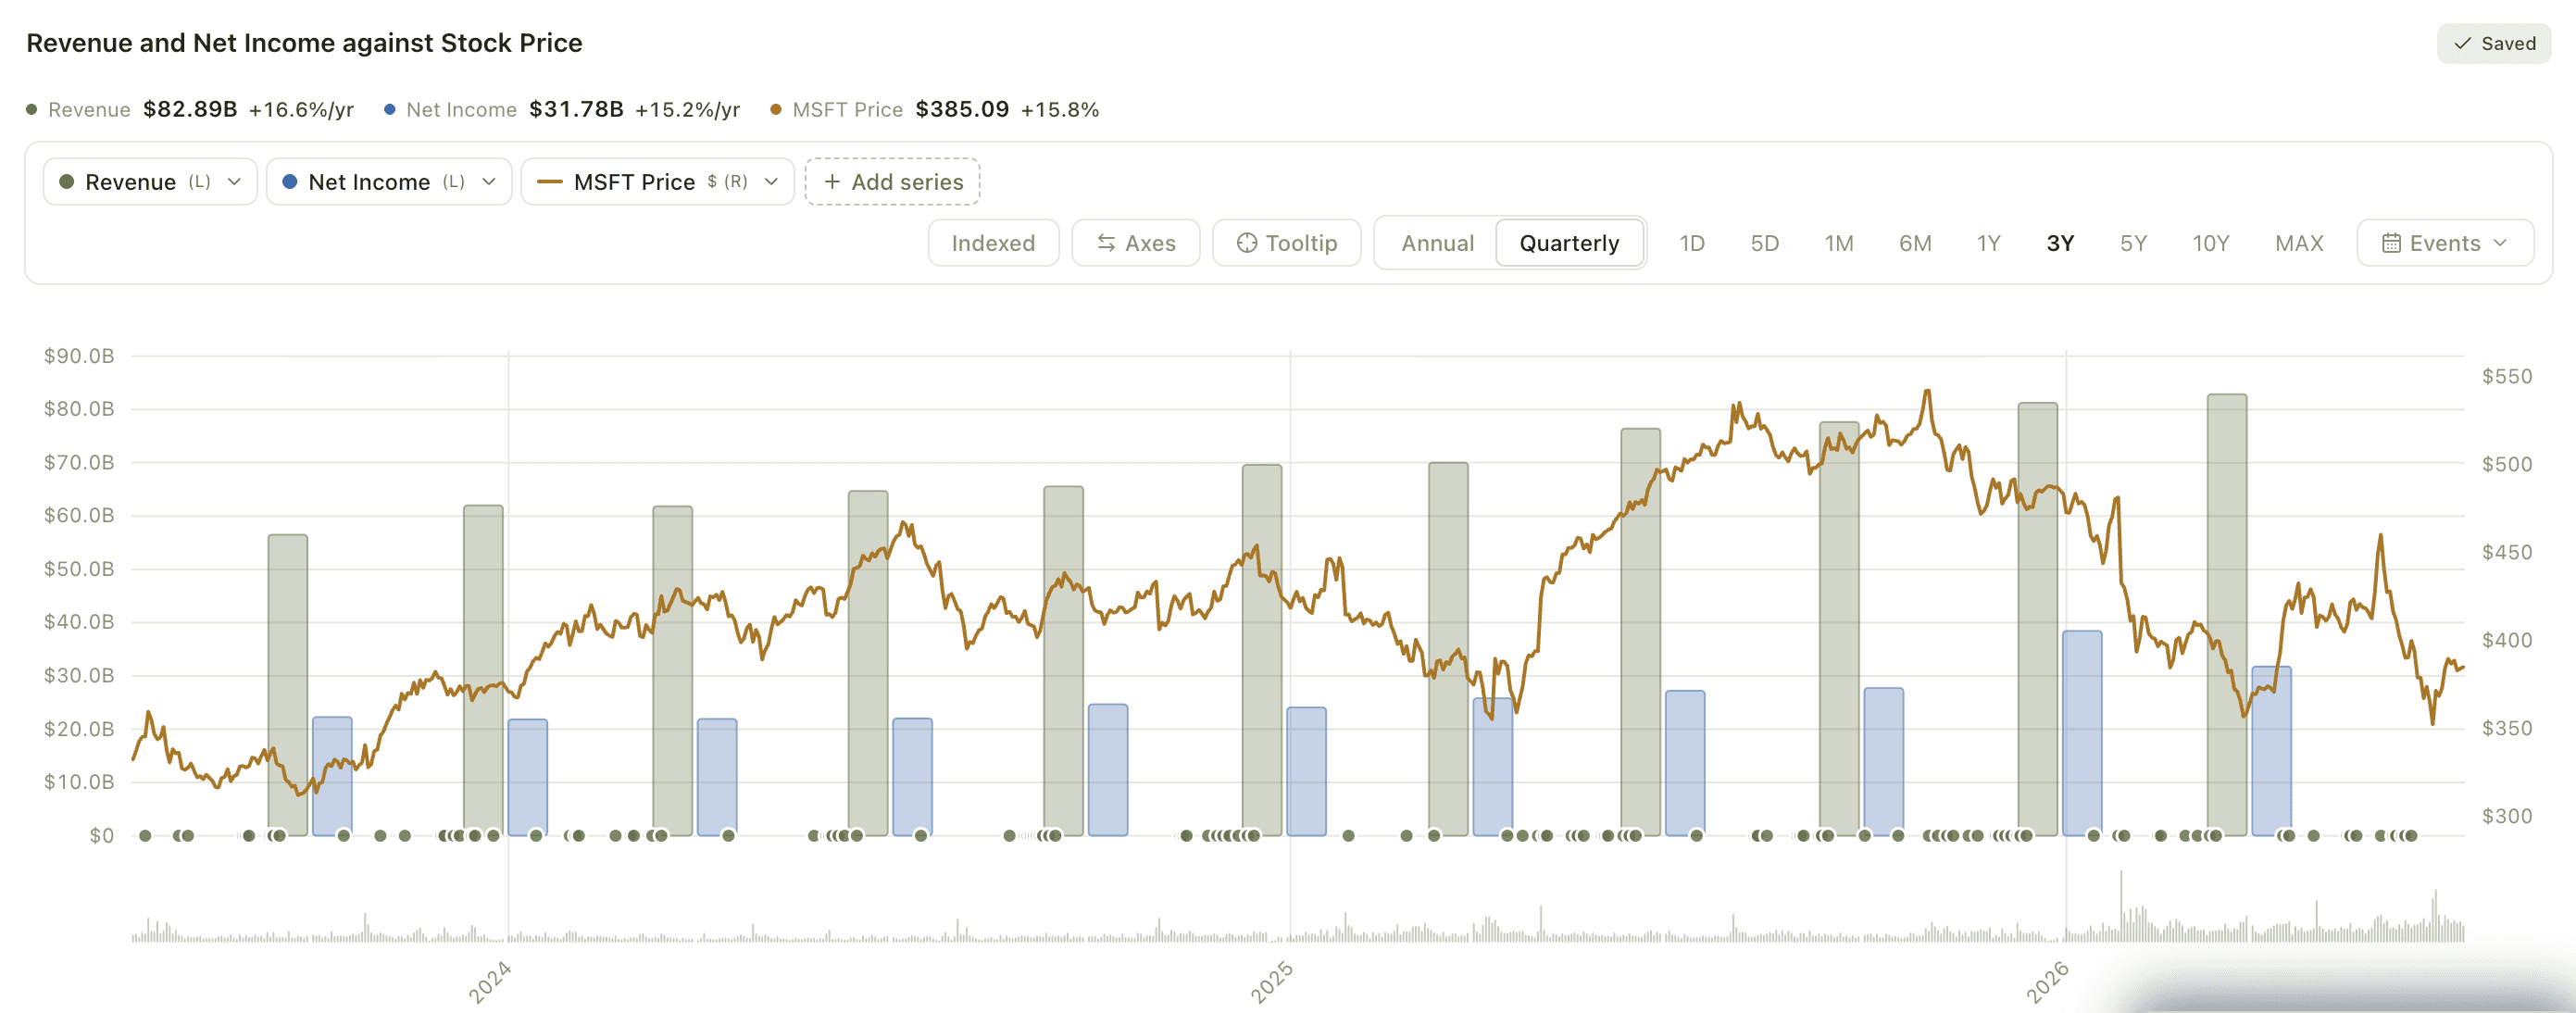
A chart library, not screenshots
Save it once, cite it everywhere
Charts you keep go into your library with live previews — and you can @mention any saved chart inside a thesis, where it renders as evidence next to your reasoning. No more pasting stale screenshots into documents.
- Saved charts stay live as new data prints
- @mention charts directly inside thesis documents
- A visual library rail for every chart you have kept
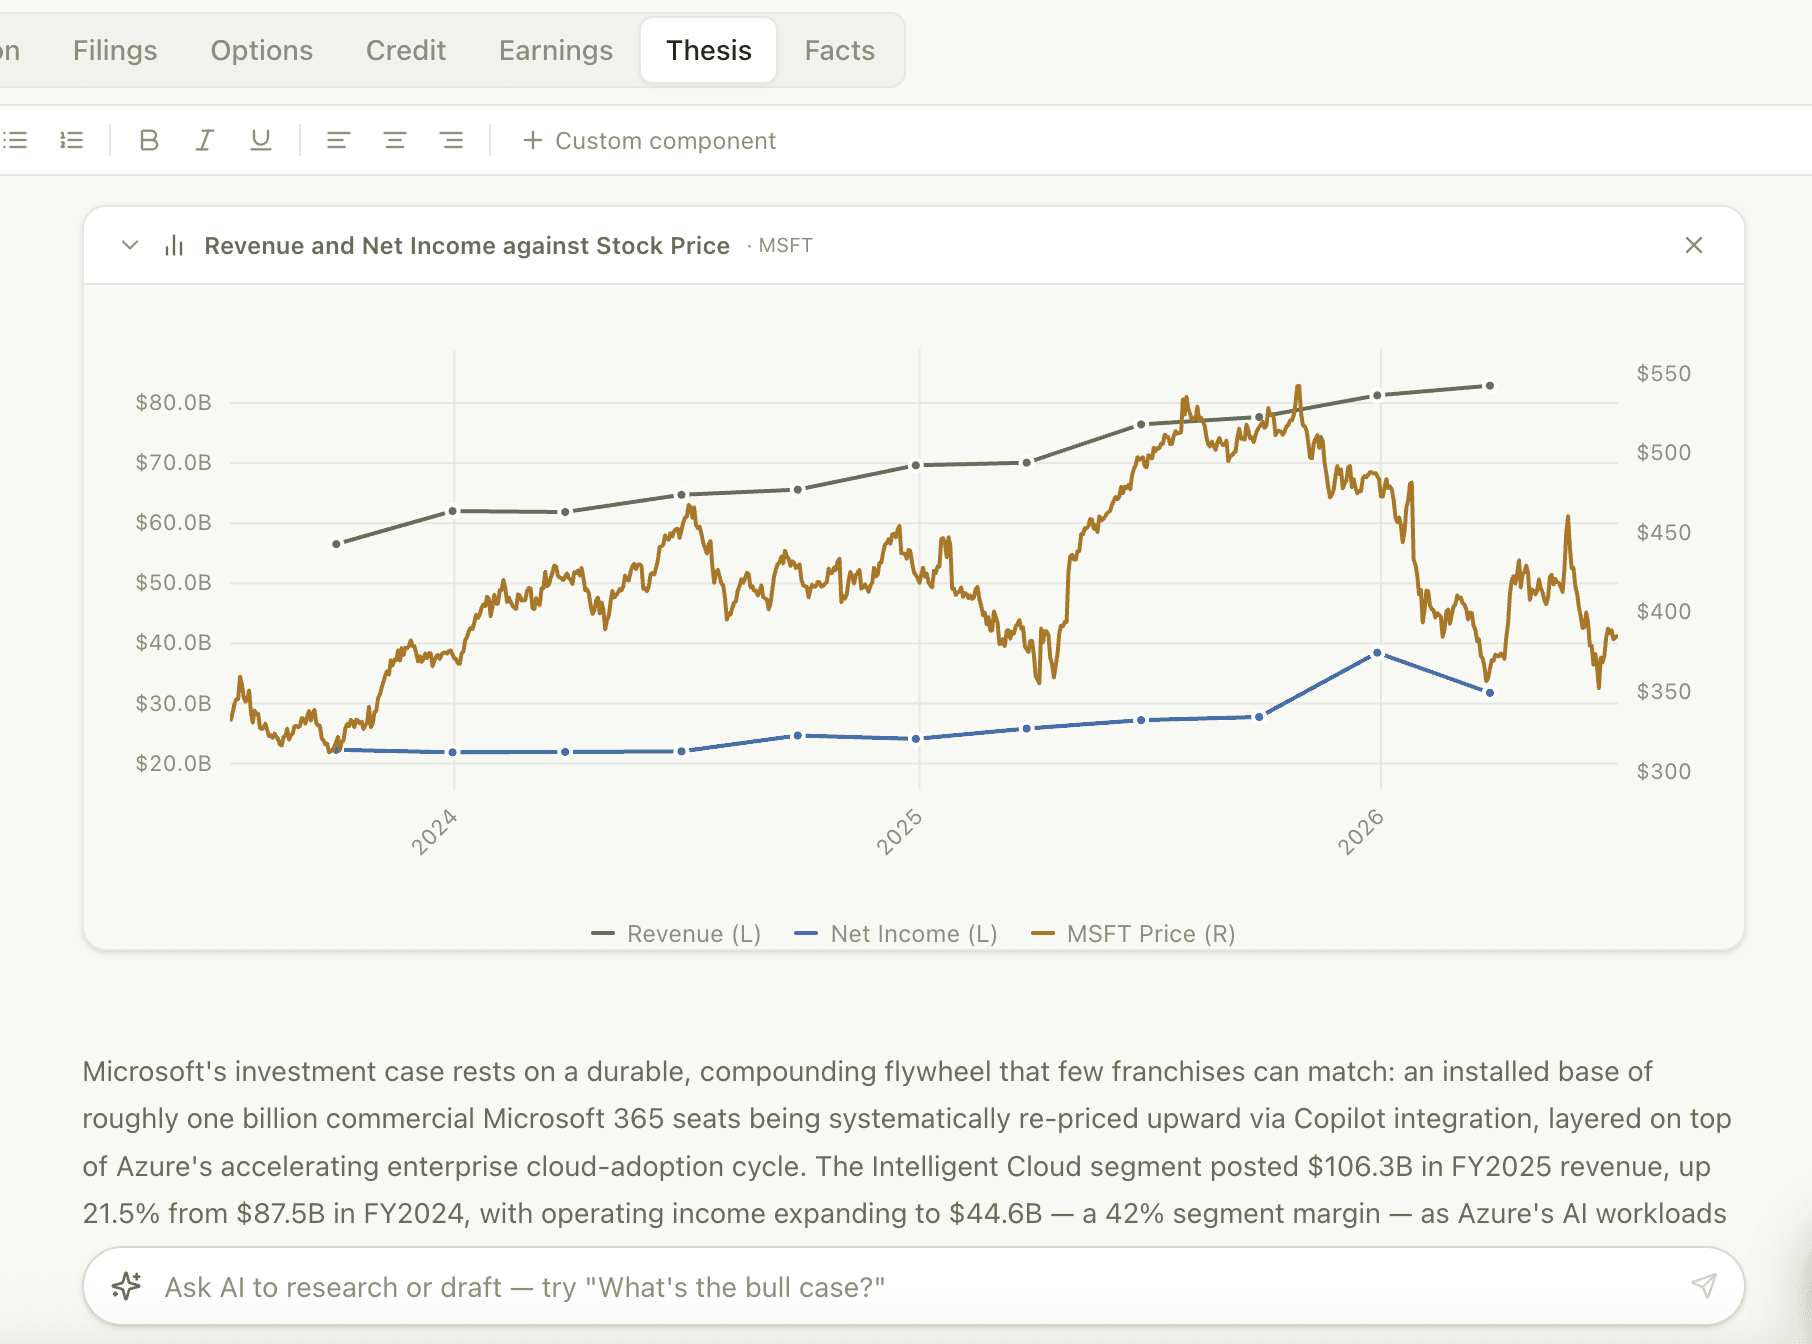
At a glance
Natural-language charting
Describe the chart; the AI builds the spec on live data in seconds.
Composable series
Metrics, prices, comparisons, indicators, and derived ratios — one series model for all of it.
Dual-axis by design
Chart margin percentage against revenue dollars without fighting the tool.
@mention in theses
Saved charts embed live inside your thesis documents as citable evidence.
Frequently asked questions
- What can I chart with Smart Charts?
- Anything in the terminal: prices, fundamentals like revenue or margins, segment-level KPIs, valuation multiples, technical indicators, and custom ratios derived from any two metrics — for one company or several, on a single canvas with optional dual axes.
- How does natural-language charting work?
- You type a description — for example, "AAPL services revenue vs. total gross margin, quarterly, 5 years" — and the AI parses it into a chart specification over live data. The result opens in the full chart builder, so you can refine anything it got wrong.
- Can I chart fundamentals and price on the same chart?
- Yes. Neural Markets uses one unified chart system, so price series, financial metrics, comparisons, and indicators compose freely — with dual axes when the units differ.
- Do saved charts update automatically?
- Yes. A saved chart is a live specification, not an image — it re-renders with current data every time you or your thesis opens it.
Investment research is fragmented.
It shouldn't be.
Replace spreadsheets, scattered notes, and stale decks with a single tool.